

Sometimes you know what you want to understand about a chart, but aren’t sure where to start. Maybe a move looks unusual, an indicator is unfamiliar, or you want to make a chart easier to read.
Chartspire’s AI assistant lets you ask those questions while you work with your chart. It can summarise chart data, look at a particular range, explain indicators and help make supported edits. Here are a few ways to use it.
The screenshots below come from a real Chartspire session. They show examples of the workflow; the prices and answers will vary on your chart. Click any screenshot to see it at full size.
Ask about what’s on the chart
Start by adding the chart you want to discuss to the conversation. Then ask a direct question. For example:
Summarise the last 30 bars. What stands out?
The assistant can read details such as the symbol, interval, visible range, indicators and loaded candles. It can also calculate statistics for a range, including returns, volatility, swing highs and lows, and support and resistance clusters.
If you’re curious about a particular part of the chart, narrow your question:
What was the largest move in this range?
What does the RSI show here?
Can you explain the 50-period EMA in plain language?
The assistant’s response is an explanation of the chart data, not a recommendation about what to do.
Use Ask mode to explore
In Ask mode, the assistant can read chart information and answer questions without changing the chart. It’s a good place to start when you’re learning an indicator or trying to make sense of a price move.
For example, you might ask:
Explain what an EMA measures, then describe the one on this chart.
You can ask follow-up questions in the same conversation. If you want to look at a different chart or range, add it to the conversation so the assistant has the right context.
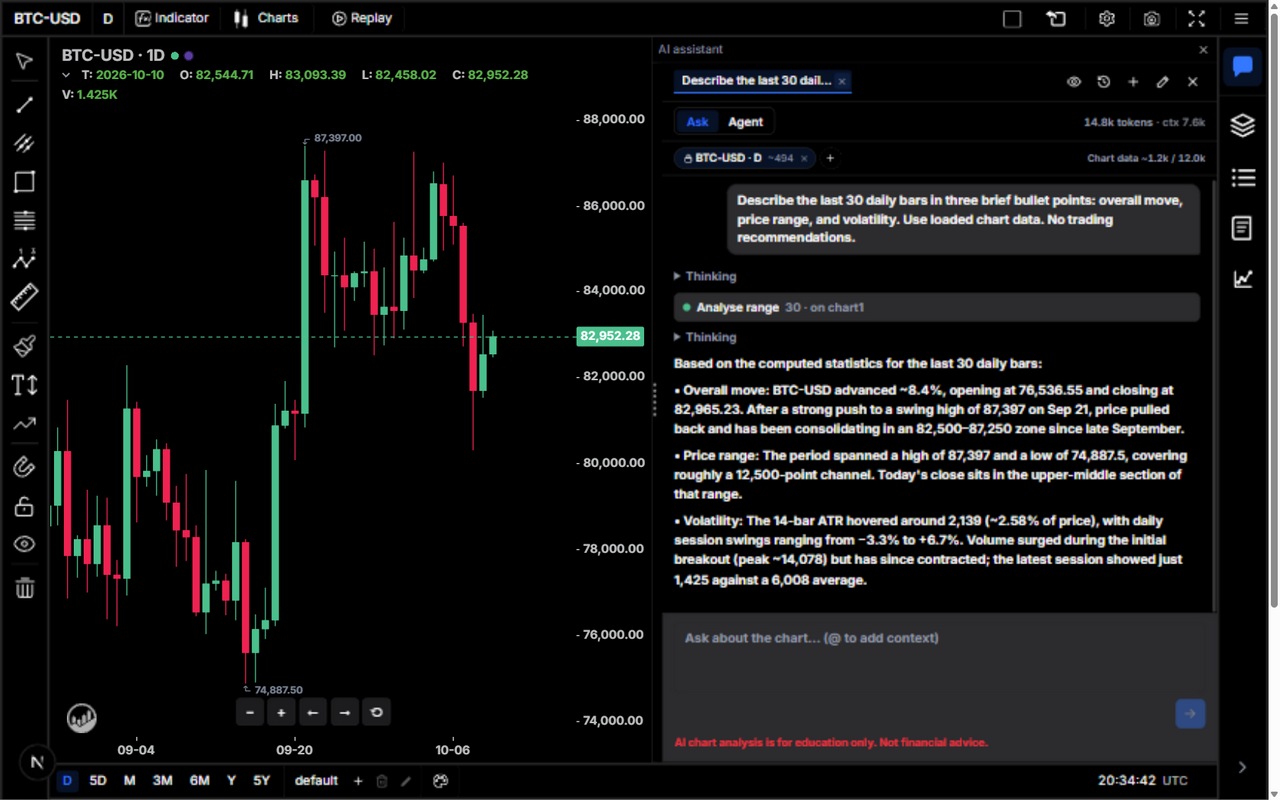
In this example, Ask mode breaks the last 30 daily bars into overall movement, price range and volatility.
Let Agent mode help with chart edits
When you want to change the chart, switch to Agent mode. You can ask it to make supported edits, such as adding an indicator or drawing a label at a price level.
Try a request like:
Add a 20-period EMA and a 50-period EMA.
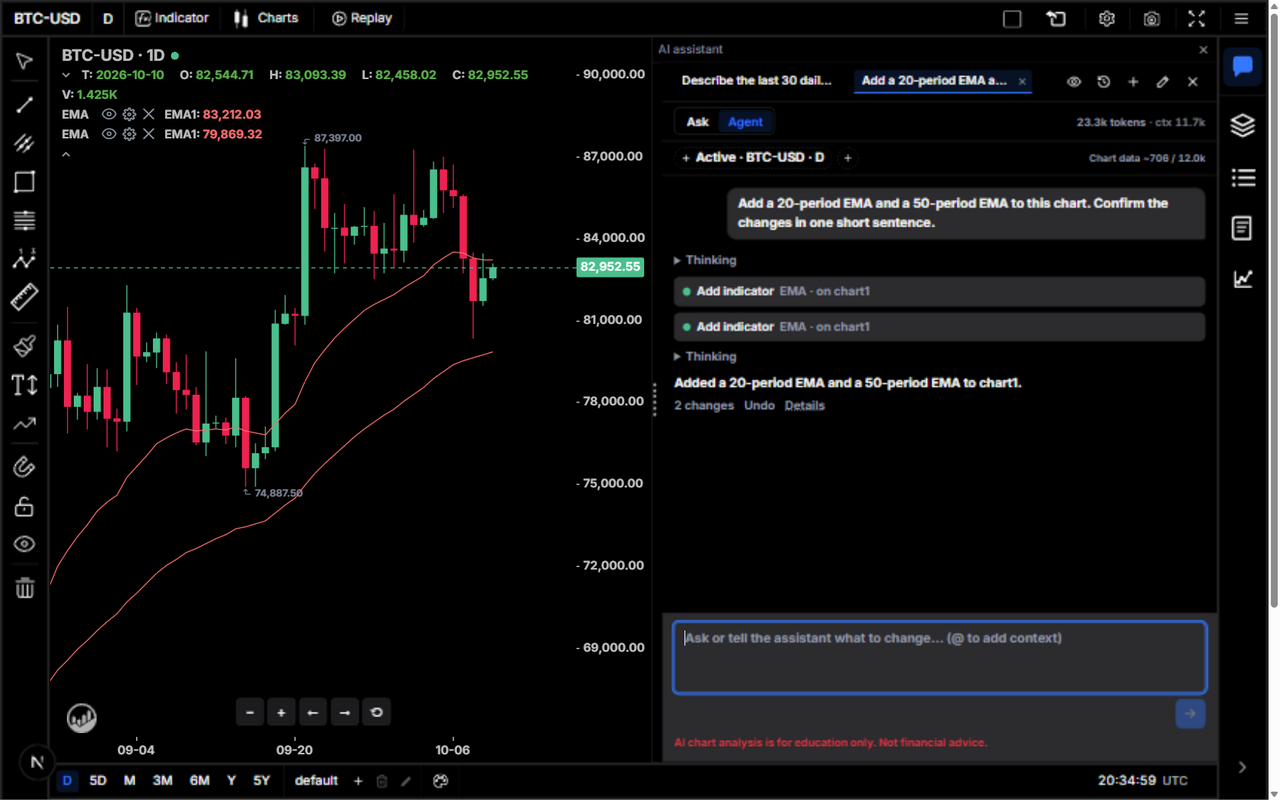
The two EMAs appear on the chart, and the assistant lists the changes with an Undo option.
Or:
Label the swing high and swing low in the visible range.
Take a look at the chart after the assistant makes a change. You can undo edits, and some actions require your approval first. Think of the result as a starting point you can adjust to suit your chart.
Give it the right context
The assistant can only answer well when it knows which chart you mean. Check that the chart is included in the conversation before asking a detailed question. If you’re comparing charts, add both. If you’re asking about a specific stretch of time, include that range or describe it clearly.
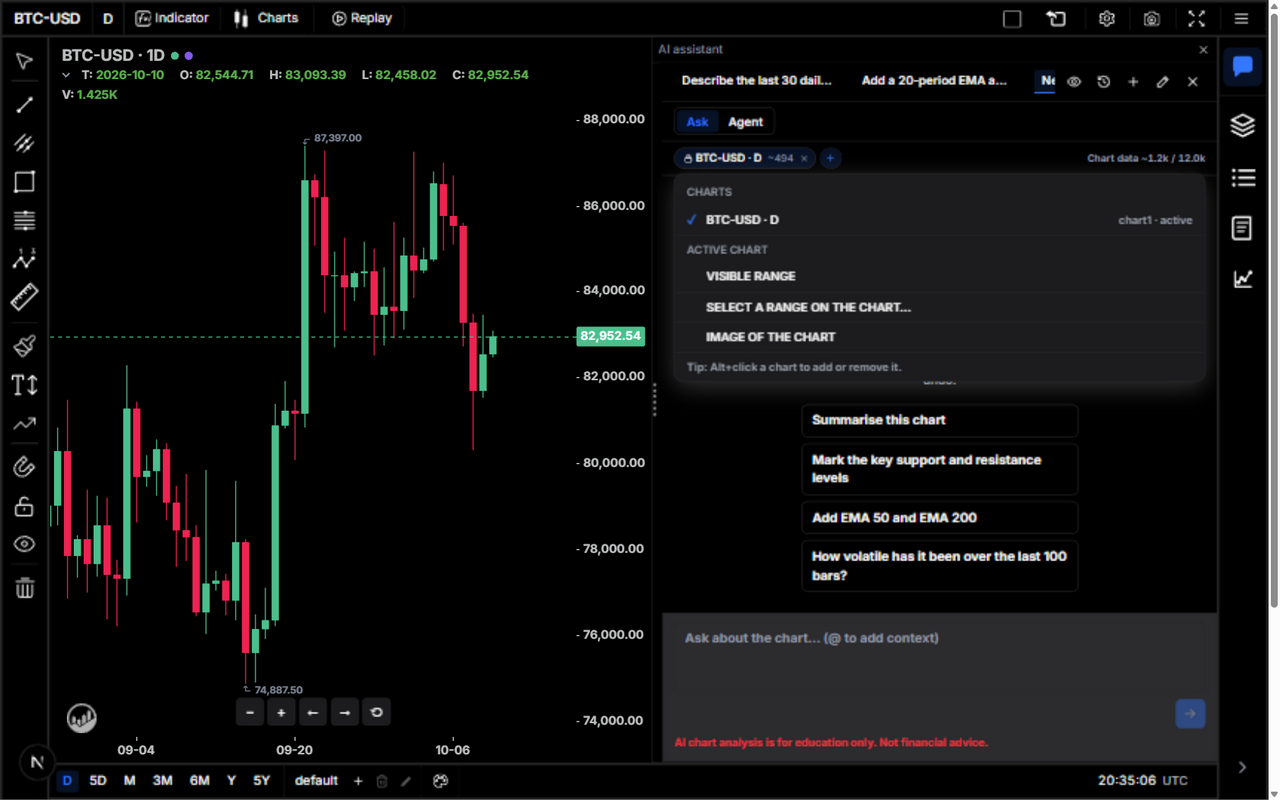
Use the + button beside the chart chip to add context, including a range or a chart image.
It also helps to say what kind of answer you’re after. For instance:
Give me a short summary, then explain the chart details behind it.
A little context can save a lot of back and forth.
Treat the answer as a place to start
AI can help you inspect and organise chart information, but it can also miss details or get an interpretation wrong. Check important values against the chart, particularly if the data is still loading or the range you asked about isn’t visible.
Chartspire’s assistant helps explain and visualise market data. It doesn’t give personal financial advice or tell you to buy, sell or hold. Use it to support your charting and keep your own judgment in the process.
If you’re not sure where to begin, ask: “What stands out on this chart, and which details are you using?” Then follow up on anything you’d like to understand better.